
A Guide to Cryptocurrency Indicators
If you’re a relative newcomer to cryptocurrency trading, it’s natural to feel a bit intimidated by the thought of using technical analysis. At first glance, technical trading is a discipline that features a lot of unusual jargon and some fairly advanced-sounding concepts.
Yet the truth is that almost anyone can become an effective technical trader — you just need to build a proper foundation by learning some of the basics. Once that foundation is in place, even the more sophisticated analytical indicators will become fairly simple to grasp, allowing you to trade with a powerful new set of tools at your disposal.
Technical Indicators Explained
When traders evaluate assets such as stocks or cryptocurrency, they typically do so through two prisms: Fundamental analysis and technical analysis.
- Fundamental analysis attempts to gauge the intrinsic value of an asset by examining variables such as sales, profits, competitors, assets, liabilities, etc.
- Technical analysis, on the other hand, is solely concerned with the evaluation of statistical trends gathered from trading data, such as price and volume. Technical analysts look at price patterns, chart formations and a variety of key indicators to spot trading opportunities.
These indicators are essentially calculations based on an asset’s price, volume or open interest. Some of the most popular of these indicators include Relative Strength Index (RSI), Bollinger Bands, and moving averages. These indicators are used widely in both the stock and cryptocurrency markets and have equal application in both realms.
With that in mind, let’s take a closer look at how these technical indicators are applied in cryptocurrency markets.
How Technical Indicators Are Used in Cryptocurrency Markets
Technical indicators, while not a prerequisite for trading success, offer cryptocurrency traders more valuable crypto trading tools to use while evaluating assets and markets. That’s because technical indicators can be used to identify both short and long-term trading opportunities. Many trading platforms offer access to popular technical indicators, which can then be used as the basis for trading, as they help identify buy and sell signals.
While there are a wide variety of technical indicators available, you should be aware that there is no one-size-fits-all solution; choosing the right indicators depends largely on your own trading strategies and analysis. Along those same lines, successful trading can happen without the use of indicators as well.
With that said, there are some indicators that have broad appeal, thanks to their forecasting utility and easy to understand nature. Some of the best indicators for cryptocurrency include the following:
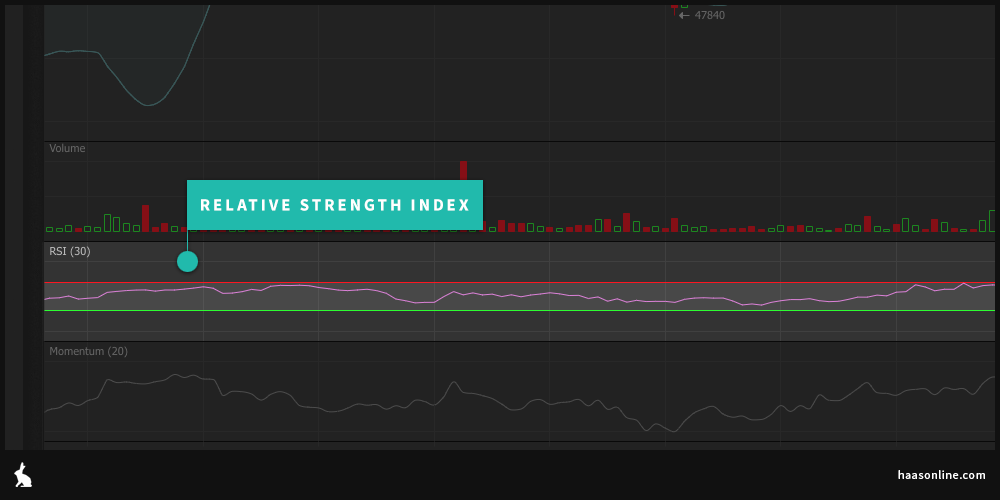
- Relative Strength Index (RSI). The RSI is a momentum indicator, oscillating between zero and 100, that measures the speed and change of price movements. When the RSI exceeds 70, it indicates that an asset may be overbought, signaling a possible sell opportunity. When the RSI dips below 30, it indicates that an asset may be oversold, signaling a possible buy opportunity. RSI is generally tracked over a 14-day period but may be adjusted to evaluate longer timeframes. The RSI is useful for cryptocurrency traders because it offers a simple numerical representation of overbought or oversold conditions.
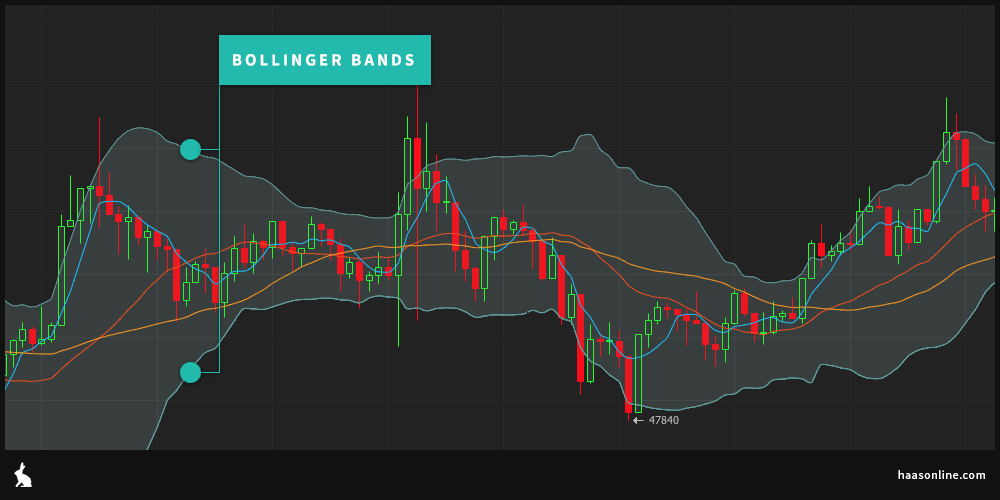
- Bollinger Bands. The Bollinger Band indicator is represented by lines on a chart that are plotted two standard deviations away from the simple moving average of an asset’s price. In other words, the price of an asset is bracketed by upper and lower lines (or bands). When these bands widen, volatility is increased; when the bands constrict, volatility is reduced. Bollinger Bands are popular among cryptocurrency traders because they provide a visual reference point for identifying overbought and oversold conditions. The closer the price line goes to the upper band, the more overbought the market, while a move toward the lower band indicates an asset may be oversold.
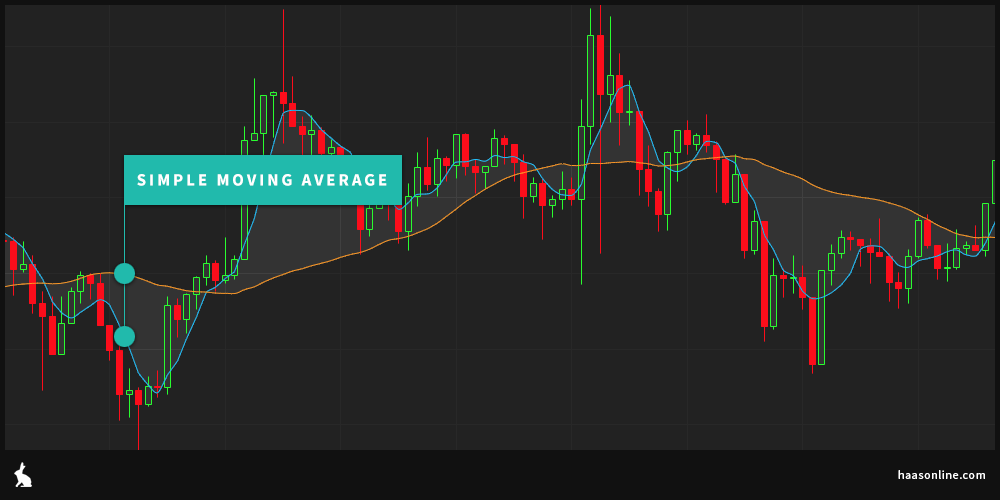
- Simple moving averages (SMA). A simple moving average is a representation of an asset’s price over time. It is calculated by adding closing prices then dividing that figure by the number of time periods in question. Cryptocurrency traders pay attention to this indicator because it can track the development of new trends and opportunities. For example, if a short-term average crosses above a long-term average (a so-called “golden cross”), it may signal the development of an uptrend. A simple moving average is also useful because it is highly customizable, as it can be adjusted to fit long or short-term time horizons. Another variation of this indicator, the moving average convergence divergence (MACD), shows the relationship between two moving averages of an asset’s price. This is another tool that can identify buy and sell signals.
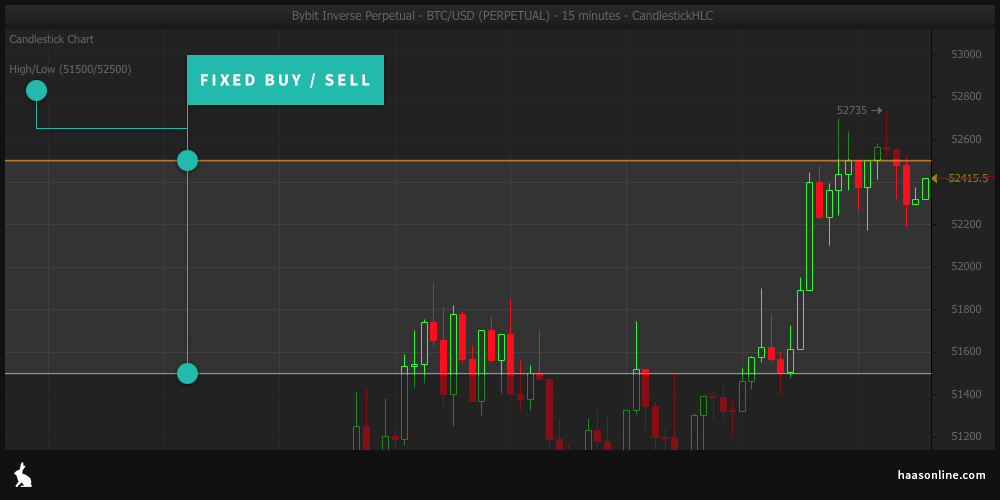
- Fixed Buy/Sell. This is a very basic yet popular tool that allows traders to define fixed price points to enter or exit their cryptocurrency positions. Fixed Buy/Sell is often incorporated in algorithmic trading. A variant of Fixed Buy/Sell, called Dynamic Buy/Sell, allows an advanced bot to make these decisions on behalf of the trader by evaluating price over a designated period of time and creating buy/sell thresholds.
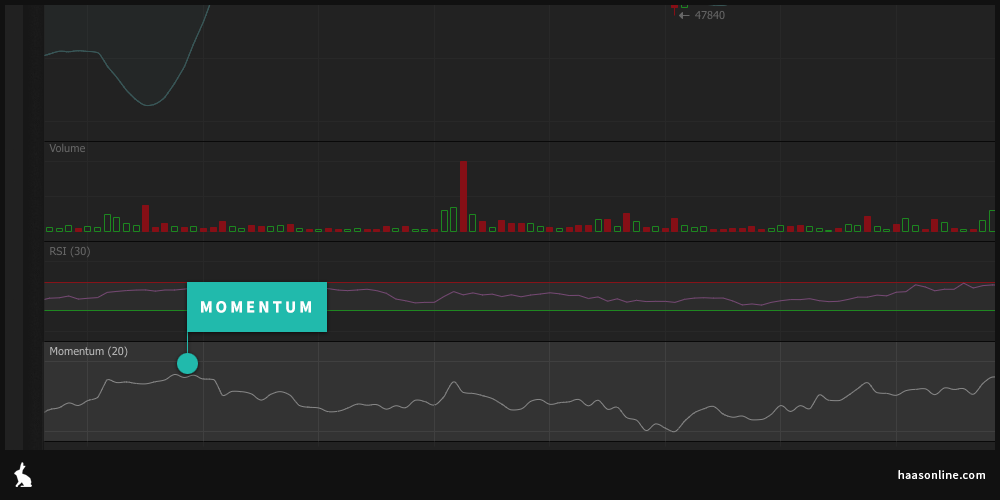
- Momentum. This indicator helps cryptocurrency traders gauge the strength of a price movement by comparing closing prices over time. The momentum indicator is represented by a single line on a chart, and traders can determine how fast price is moving by reading this momentum indicator. The higher the reading is above 100, the faster the price is rising. Conversely, the lower the number is below 100, the faster the price is moving to the downside. This is a highly useful tool, as it can identify when trends may be gaining or losing momentum. For example, if the price is moving downward, but the lows on the momentum indicator are rising, this can indicate that a sell-off may be losing steam.
The Takeaway
Technical indicators may not be absolutely necessary in order to find success in the market, but they can provide you with a broader perspective on developing trends and conditions. This is one reason why crypto indicators and technical analysis have become an entrenched part of the trading landscape. By learning about and leveraging some of the best technical indicators for cryptocurrency, it’s possible to support your analysis with a wider spectrum of information.
If you’re a trader seeking an edge — or just a fuller picture of market conditions — we encourage you to start a 14-day trial or try a free demo for a hands on feel of harnessing the power of technical analysis and the use of automated bitcoin trading bots.


